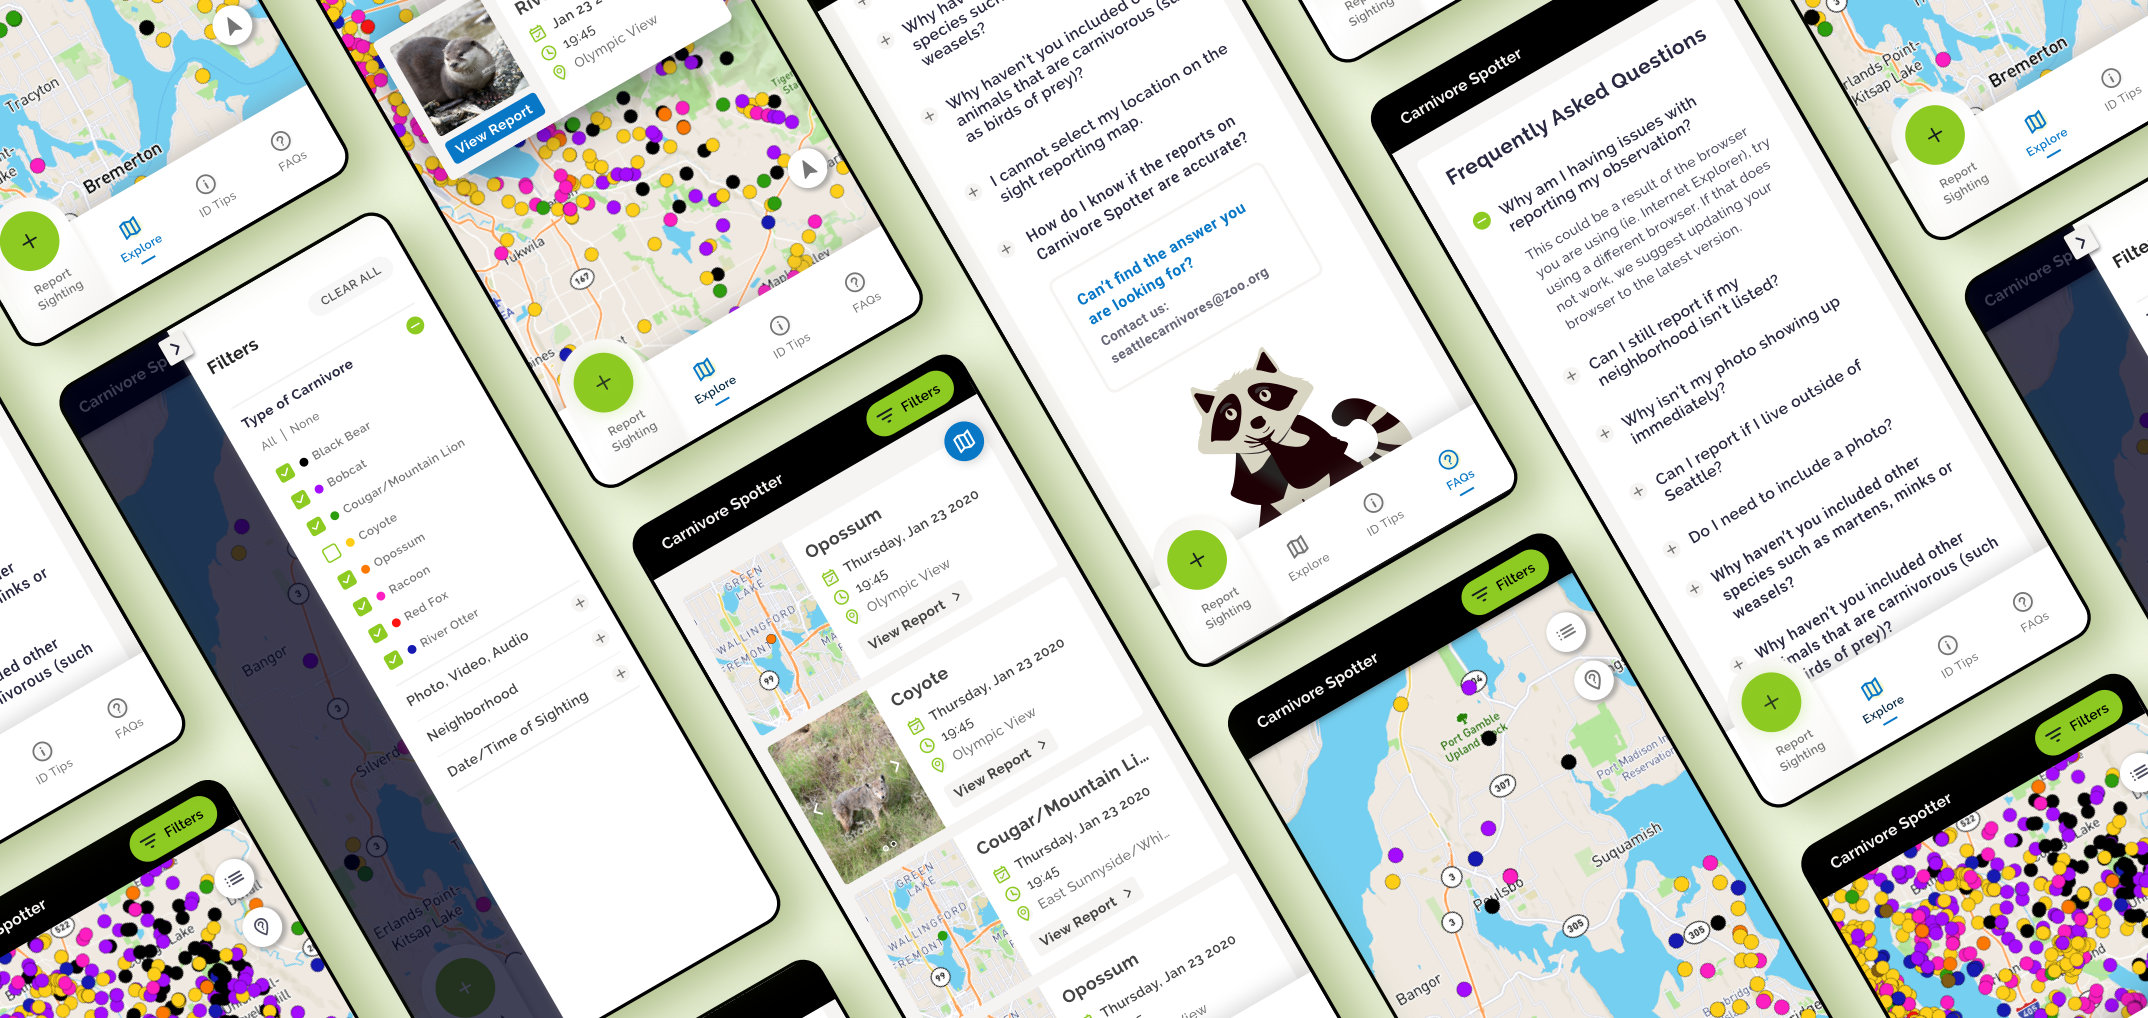
As the number of sightings grew, it was important to have robust filtering to help users find relevant reports. After the initial launch, we gathered user feedback from a dozen users and I leveraged the insights to identify ways to improve the filters.
Users reported getting lost in the filters, especially while scrolling through the long list of neighborhoods. To fix the issue, I decided to add fixed headers for each filter category that would always be visible, and allow the user to collapse the filter categories as needed. I also added the ability to search for a neighborhood instead of scrolling.
Users were especially interested in seeing reports that had media attached (photos/videos/audio), so we added the ability to narrow down the results to only display those with media.
Enhancing filtering capabilities
The initial MVP used the same font for each element in the various UI Cards throughout the application; every element was the same size, weight, and color. This made it difficult for users to find relevant information. To combat this, I added visual hierarchy by utilizing different weights and contrasts and adding icons to draw users' eyes to the relevant information.
We noticed that users would unintentionally hit the wrong report by accident and we knew that this issue would deepen as the number of sightings on the map grows. Before the issue worsened we decided to display all reports within the touch point area (40px) in a carousel style card component instead of just bringing up a single report.